Tutorial: Discovering, loading and plotting data with intake and xarray
We need to have intake installed (see https://server-howto.readthedocs.io/en/latest/data_organization.html#discover-data-with-intake).
[1]:
import intake
Display figures inside notebook
[2]:
%matplotlib inline
The observation datasets interpolated on the ASTE grid are listed in the following catalog:
[3]:
cat = intake.Catalog('/local/data/artemis/catalogs/ASTE_catalog.yml')
You can see what datasets are available in the catalog with:
[4]:
list(cat)
[4]:
['MLD_deBoyerMontegut',
 'Biomes_FayMcKinley',
 'NPP_CBPM_MODIS',
 'NPP_CBPM_SeaWIFS',
 'NPP_CBPM_VIIRS',
 'NPP_EppleyVGPM_MODIS',
 'NPP_EppleyVGPM_SeaWIFS',
 'NPP_EppleyVGPM_VIIRS']
The intake catalog provides all the necessary information on the data location, type,… so the loading process can be done easily with:
[5]:
npp_obs = cat.NPP_EppleyVGPM_MODIS.to_dask()
The dataset obtained can be plotted using xarray functions.
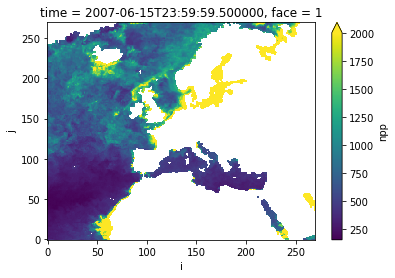
[6]:
npp_obs['npp'].sel(time='2007-6', face=1).plot(vmax=2000)
[6]:
<matplotlib.collections.QuadMesh at 0x7f2fdc06a438>